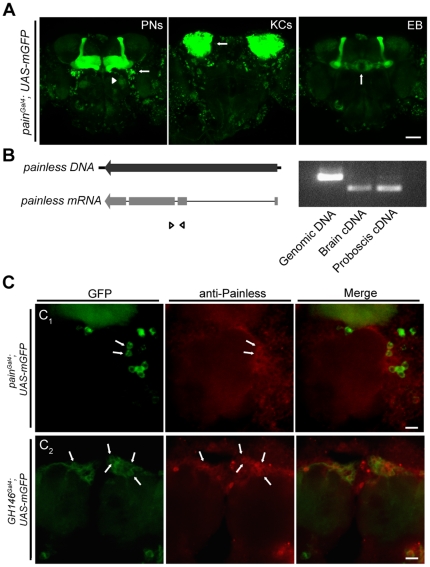
Figure 1. Expression of painless in the central nervous system.
(A) Confocal images of the brains of painGal4; UAS-mCD8-GFP flies. Cells in green were painGal4-positive. White arrows indicate the projection neurons (PNs), the Kenyon cells (KCs), and the ellipsoid body (EB), respectively. White arrowhead in (A) shows one glomerulus innervated by neurites of painGal4-positive PNs (Scale bar, 50 µm.) (B) Left, schematic structure of the painless gene locus and mRNA. Small triangles represent the PCR primers used. Right, RT–PCR products of mRNAs from brains and proboscis, with PCR product from genomic DNA as a control. (C) Confocal images of fly brains stained with the antibody against Painless. The genotype of each brain is indicated. White arrows show the PNs expressing both Painless and GFP. White arrowhead in (C1) indicates the glomerulus formed by the neurites of GFP–positive PNs. (Scale bar, 10 µm.)

