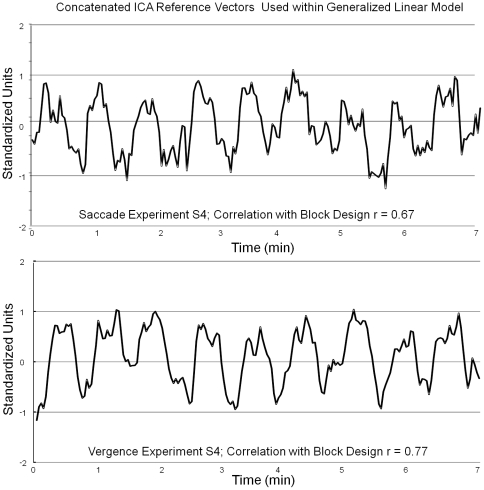
Figure 2. Typical reference vectors from one subject (S4) from the saccadic data set (upper plot) and the vergence data set (lower plot).
The source signals have a high Pearson correlation coefficient with the experimental block design (r = 0.67 for the saccade experiment and r = 0.77 for the vergence experiment).

