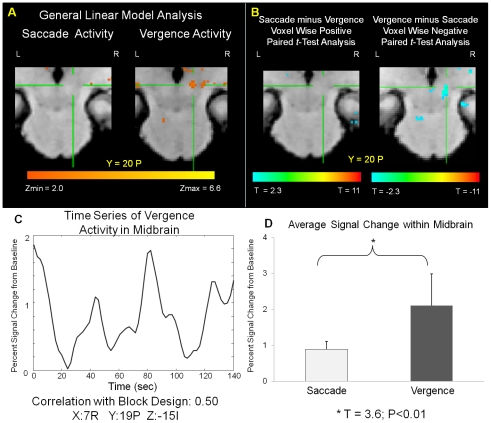
Figure 7. Functional activity within the midbrain using a GLM analysis (Plot A).
Positive and negative paired t-test statistical spatial map showing differentiation between the midbrain for the fixation versus random saccadic and vergence tasks identified via the cross hair. A positive T value is for the saccade minus vergence data set and a negative T value is for the vergence minus saccade data set (Plot B). Typical time series signal from the midbrain which has a correlation of 0.5 with the block design (square wave) (Plot C). Talairach Tournoux coordinates are: 7 R, 19 P and 15 I. Comparison of the percent signal change from baseline of the same time series signals from the saccade and vergence data sets within the midbrain (Plot D).

