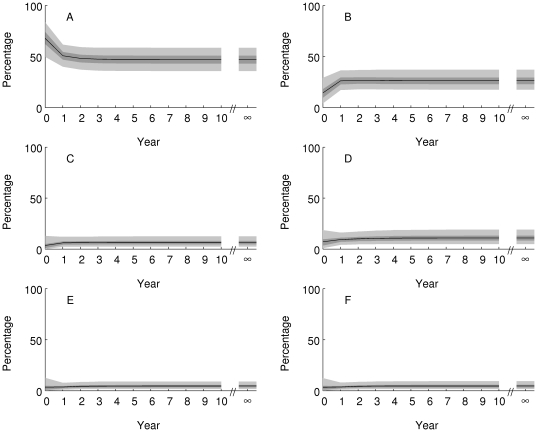
Figure 6. Projected percentage of Caribbean reefs in each state (panel labels match state definitions in Table 1 ) over the 10 years from 2006 (Year = 0) and at equilibrium (Year = ∞).
The black line is the posterior mean, the dark shaded area is the 50% equal-tailed credible interval, and the light shaded area is the 95% equal-tailed credible interval.

