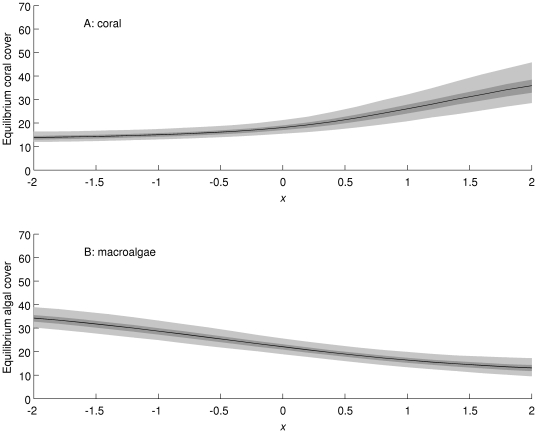
Figure 10. Projected responses of (A) coral cover and (B) macroalgal cover in the Caribbean to environmental change scenarios (horizontal axis: x = 0 corresponds to current conditions, negative values to conditions less favourable for coral, and positive values to conditions more favourable for coral).
The black line is the posterior mean, the dark shaded area is the 50% equal-tailed credible interval, and the light shaded area is the 95% equal-tailed credible interval.

