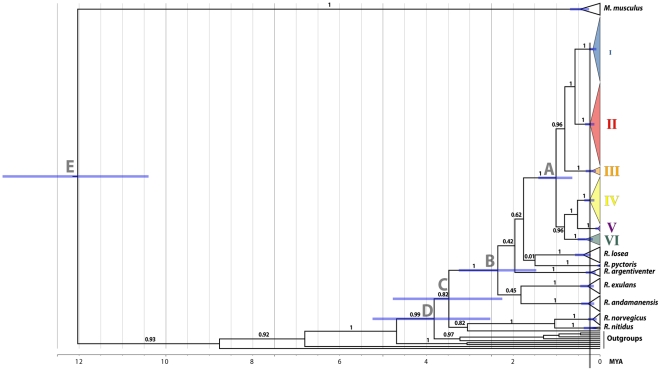
Figure 3. Divergence time estimates for key diversification events in the Rattini and the Rattus rattus Complex.
Result of BEAST analysis using an uncorrelated lognormal relaxed-clock model and with HKY+I+G6 nucleotide substitution model on data partitioned by the three codon positions. MCMC analyses were run for 30,000,000 steps, with posterior samples drawn every 1000 steps after a burn-in of 3,000,000 steps. The general constant size coalescent model was used as tree prior. Divergence time estimates for labelled nodes A–E are shown in Table S3, References S1.

