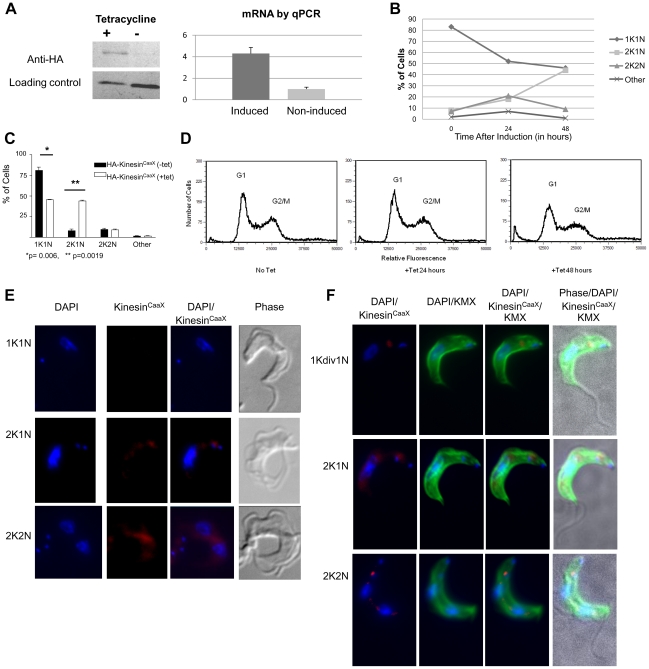
Figure 4. KinesinCaaX localizes near the nucleus and kinetoplast and is enriched in post-mitotic cells.
(A) Left Western blot of whole cell lysates of bloodstream form (BSF) T. brucei tagged HA- KinesinCaaX cell line either induced (+) or non-induced (−) for 48 hours. While more material is loaded in the (−) non-induced lane, much more HA-Kinesin is observed in the (+) induced lane. Right Quantitative PCR (qPCR) showed induced cells had 4.2 times more mRNA for KinesinCaaX than non-induced controls (error bars are SD). (B) DAPI staining and fluorescence microscopy reveals a larger proportion of cells with 2 kinetoplasts and one nucleus (2K1N) and a reduction in 1K1N cells in tetracycline-induced KinesinCaaX T. brucei cells compared with non-induced cells, with the effect becoming prominent at 48 hours (C) The mean and SD of 2 experiments at 48 hours. Statistical analysis was performed using a Student T test. (D) Ectopic expression of KinesinCaaX results in a slight decrease in G1 cells and a slight increase in cells between the G1 and G2/M peaks at 48 hours after tetracycline induction. (E) Cells were stained with DAPI to stain nuclear and kinetoplast DNA (blue), anti-HA rat mAb primary and polyclonal anti-Rat IgG Cy5.5 (red) secondary 24 hours post-tetracycline induction. Cells with 2K1N and 2K2N DNA content have an increased amount of KinesinCaaX relative to 1K1N cells. (F) Cells were stained with DAPI to stain nuclear and kinetoplast DNA (blue), FITC-anti-mouse IgG to localize the KMX mouse monoclonal antibody (mAb) that binds β- tubulin (green) and anti-HA rat mAb primary and polyclonal anti-rat IgG Cy5.5 (red) secondary that localize HA-KinesinCaaX 24 hours post tetracycline induction. β-tubulin localization demonstrates these cells have normal morphology. The cell marked 1Kdiv1N has an elongated kinetoplast consistent with a kinetoplast that is undergoing division.

