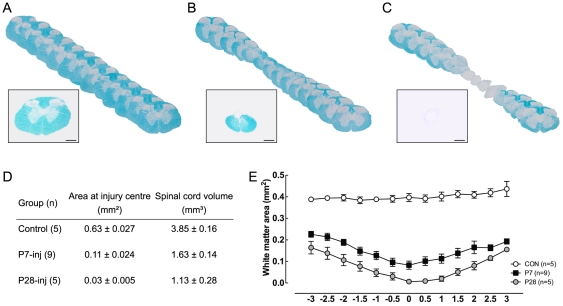
Figure 3. Reconstruction of spinal cord gross morphology for adult animals.
A: Control; B: P7-injured; C: P28-injured spinal cord. Sections (500 µm apart) were stained for Myelin (Luxol Fast Blue stain) and overlayed using Adobe Illustrator. Inset images are representative sections through the centre of the injury site (or equivalent spinal level in control cords). Scale bar is 200 µm. D : Average tissue cross-sectional area at injury centre and spinal cord volume. E: Myelin-positive white matter area in serial sections of 6 mm segment from spinal cord incorporating the injury site. Numbers on the x-axis refer to distance from the centre of injury (0) in mm.

