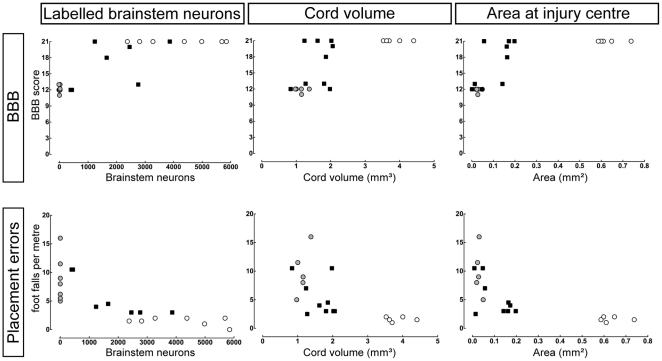
Figure 8. Correlations of structure and function.
Independent variables (numbers of labelled brainstem neurons, spinal cord volume and cross-sectional tissue in injury centre) are listed across the top; dependent variables (BBB locomotor score and grid test foot Placement errors) are listed on the left. Controls (open circles), P7-injured (black circles) and P28-injured animals (grey circles) are plotted in the grid of graphs. Correlations were calculated for P7-injured group only. None was strongly correlated except grid test foot Placement errors vs Labelled brainstem neurons (r 2 = 0.68, P<0.05; lower left).

