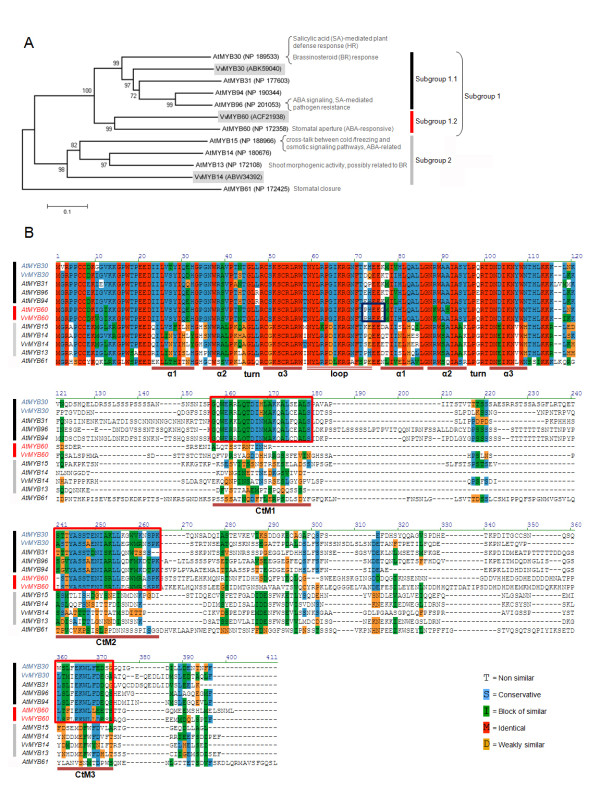
Figure 1.
Analysis of grape and Arabidopsis MYB homologues within Subgroup 1. (A), Phylogenetic relationships between Arabidopsis and grape subgroups 1 and 2 of R2R3 MYB factors, as described by Kranz et al., [13]. A consensus rooted tree was inferred using the Maximum Parsimony method, constructed with MEGA4® software. (B) Alignment of deduced amino acid sequences of subgroup 1 and 2 R2R3 MYB homologues from Arabidopsis and grape. The R2 and R3 repeats lie between the three alpha helices of each repeat. Boxes represent the C-terminal motifs CtM1, CtM2 and CtM3 (red boxes) conserved in members of subgroup 1 and the PHEEG signature (blue box), distinctive of AtMYB60 and VvMYB60 (subgroup 1.2). Amino acid residues are shaded in different colors, as indicated in the legend. Dots represent gaps introduced to improve the alignment.

