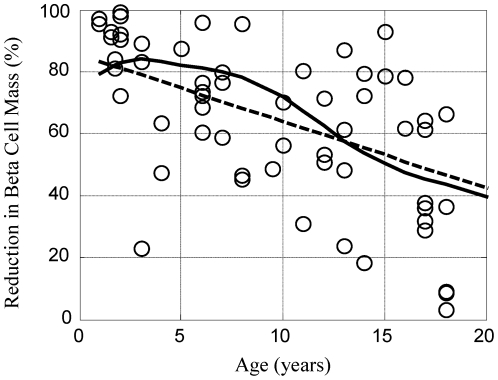
Figure 1. The growth rates for beta cell mass and total body weight exhibit different dynamic trends based upon age.
The age-associated changes in total beta cell mass (dotted line) corresponds to the product of the dynamic trends in beta cell density [11] and volume of the pancreas [11]. The change in body weight (solid line) as a function of age is an average value from male and female growth charts [20]. A similar figure appears in [13] but is included here for continuity.

