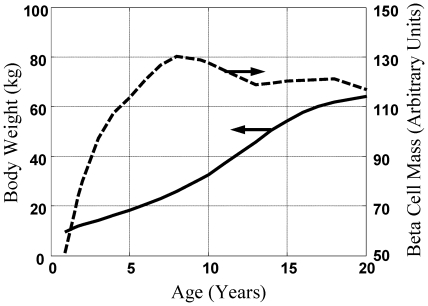
Figure 2. Comparison between the predicted and measured excess beta cell mass in recent onset patients.
The measured reduction in beta cell mass in 60 patients, under 20 years of age, that died within three weeks of diagnosis of type 1 diabetes mellitus (circles [13]) is compared against the excess beta cell mass predicted by the physiology-based mathematical model (Equation 6 - solid curve) and a trendline obtained by linear regression (dotted line). A similar figure appears in [13] but is included here for continuity.

