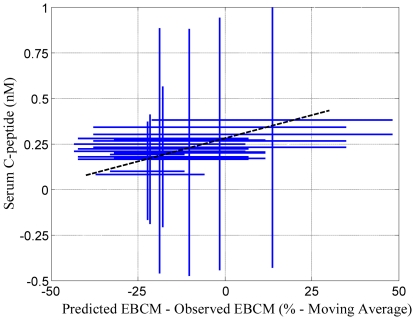
Figure 5. Correlation between residual beta cell mass and plasma C-peptide following onset of type 1 diabetes.
Reported plasma C-peptide values (y-values) are shown against the moving average value, shown in Figure 3, for the difference between predicted and observed excess beta cell mass (x-values) at the same time. The dotted line highlights the linear trend (p>0.9995 that the slope of the line is greater than zero). The standard deviations in plasma C-peptide and excess beta cell mass are represented by size of the crosses.

