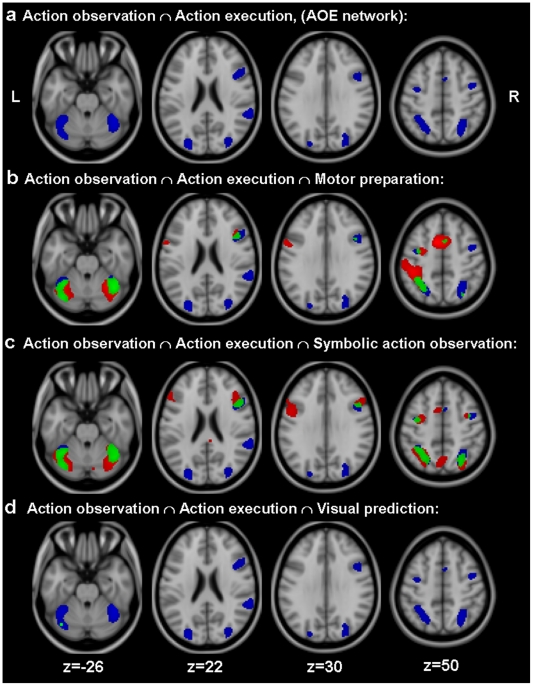
Figure 1. fMRI results.
Statistical parametric maps (t values) for each of the four conjunction analyses described in the methods section. The SPM for AOE is depicted in blue whereas the SPM for each individual network is depicted in red. Regions in green correspond to the overlap between each individual network and the AOE identified through conjunction analysis. Statistical parametric maps for individual contrasts and conjunctions were thresholded at t>4.85 (p<0.05 corrected for multiple comparisons, FWE) and projected on the structural template of SPM (MNI 152).

