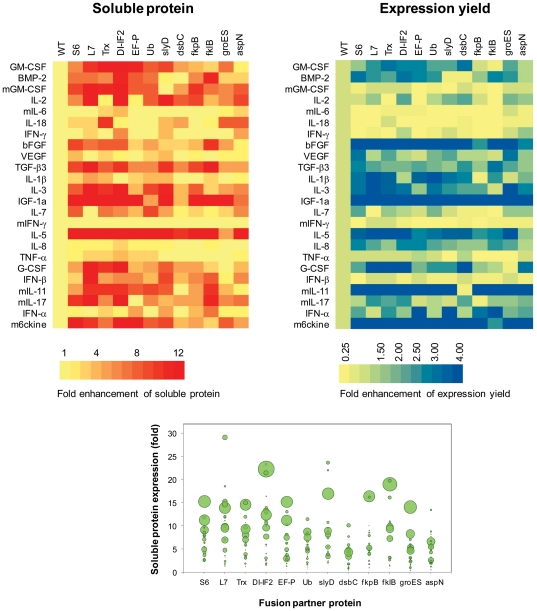
Figure 4. Combinatorial examination of fusion partners for the expression of different cytokines.
(A) Fold enhancement of soluble expression of cytokines by the examined fusion partners. (B) Fold enhancement of total expression yield by fusion with the examined fusion partners. (C) A bubble chart where the size of each bubble diameter is proportional to the fold enhancement of the expression efficiency of total protein. Detailed stacked bar graphs of individual fusion protein are shown in Figure S1.

