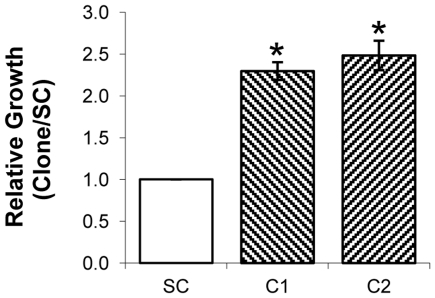
Figure 2. Quantification of cell proliferation by MTT assay.
Quantification of metabolically active cells by MTT assay in MKN45-C1 and MKN45-C2 clones and MKN45-SC control at 96h in culture. Data from 24 hours was used to set time zero and results were normalized to the data obtained with the scrambled control.*P<0.01.

