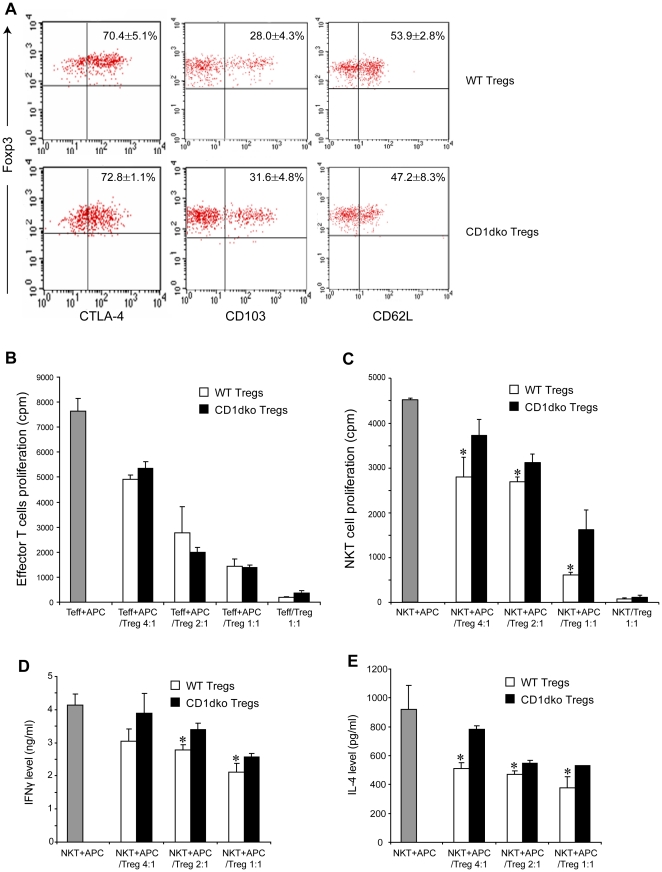
Figure 2. CD1d deficient Tregs have a reduced capacity to suppress NKT cells.
Tregs (CD4+ CD25+) were isolated from the spleen of wt and CD1dko mice. NKT cells (NK1.1+, TCRβ+) and Teffs (CD4+ CD25-) were isolated from the liver and the spleen of wt mice, respectively. A) Representative dot plots of isolated Tregs from each animal of one experiment. Mean (±SD) results were listed on the graph. Tregs from wt and CD1dko mice share similar Treg surface markers. B) Tregs suppress Teff proliferation assay. Teffs (5×10⁴/well) were co-cultured with different amount of either wt or CD1dko Tregs as labeled on the graph in present of APC (mitomycin C-treated wt splenocytes, 5×10⁴/well) and anti-CD3. Mean (±SD) results were graphed. C) Tregs suppress NKT cell proliferation assay. NKT cells (5×10⁴/well) were co-cultured with different amount of either wt or CD1dko Tregs as labeled on the graph in present of APC (α-Galcer-loaded and mitomycin C-treated wt splenocytes, 5×10⁴/well). The APCs were washed extensively to remove excessive α-Galcer before added to the co-culture. Mean (±SD) results were graphed. *p<0.05 vs wt mice. E, F) Tregs suppress NKT cell function assays. NKT cells were isolated and co-cultured with APCs and Tregs from wt and CD1dko mice, as described above. IFN-γ (E) and IL-4 (F) released to the culture media were determined by ELISA. Mean (±SD) results were graphed. (B–F, n = 3/exp, and the experiments were repeated three times). *p<0.05 vs wt mice.

