
Figure 1.
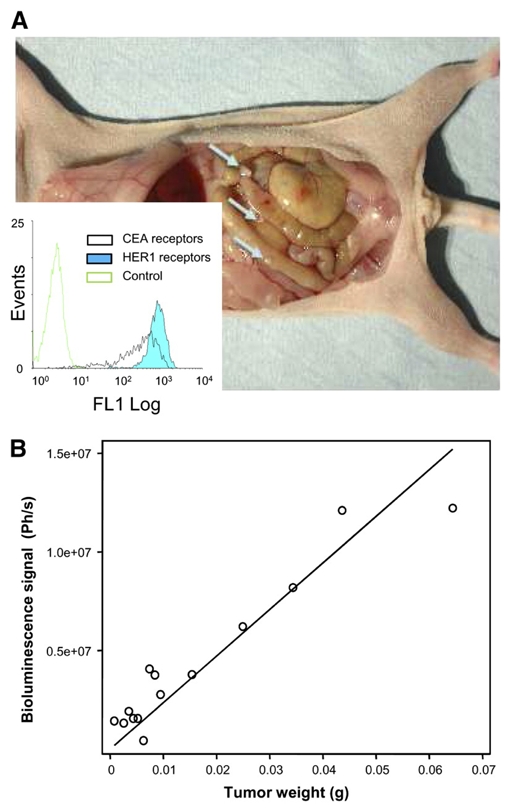
Tumor growth and bioluminescence calibration curves. A) Swiss nude mice bearing 1—2 mm xenograft A-431 tumor nodules were followed by bioluminescence imaging. Flow cytometry analysis (inset) indicated similar levels of expression of EGFR and CEA receptors at the surface of A-431 cells. B) In vivo relationship between bioluminescence signal and mean tumor weight per mouse.