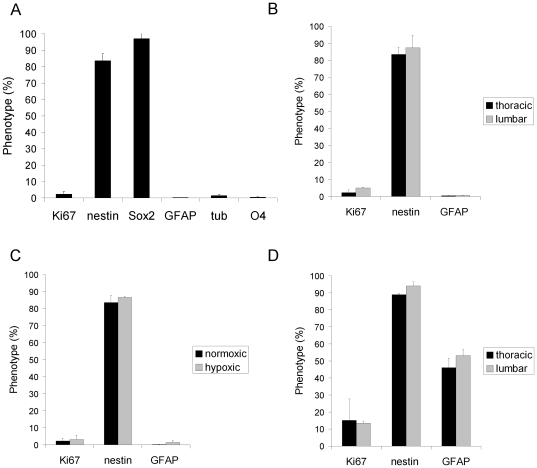
Figure 3. Phenotypic expression profile of human spinal cord NSPC in EGF/FGF2 culture.
A, NPSC primarily express nestin and Sox2, and low levels of GFAP, tubulin, and O4. Data shown is averaged from cultured cells generated from the thoracic cord of 3 independent cultures at 35, 66, and 83div. B, NSPC generated from the thoracic and lumbar spinal cord from 2 cultures (34, 66, and 82div) show similar expression levels. C, NSPC cultured in normoxic or hypoxic conditions (2 cultures at 45 and 58div) show no significant differences in Ki67, nestin, and GFAP expression. D, NSPC derived from a younger donor (34 and 45div) also show similar expression levels when cells were generated from the thoracic or lumbar spinal cord. Cultures from the young donor (D) showed significantly higher GFAP expression than cultures from the older donors (B) (p = 0.007).

