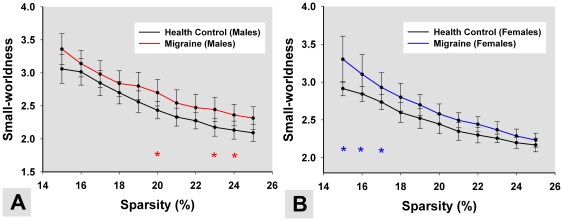
Figure 1. The mean and standard deviation of small-worldness from the resting networks at different sparsity values.
The colored lines show small-worldness differences among (A) male PM, (B) female PM and matched controls. The horizontal stars indicate the significant difference of the small-worldness between HC and PM (p<0.05, FDR corrected).

