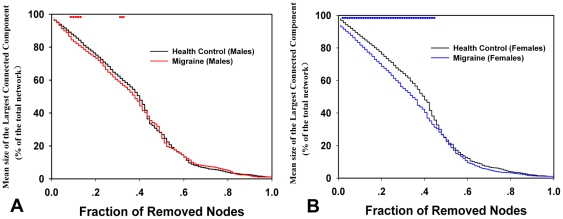
Figure 3. Network robustness analysis for targeted attacks.
Graph presents the mean size of the largest connected component versus the proportion of total nodes eliminated by targeted attacks among (A) male PM, (B) female PM and matched controls. The horizontal dotted line indicates the significant difference between HC and PM (p<0.05).

