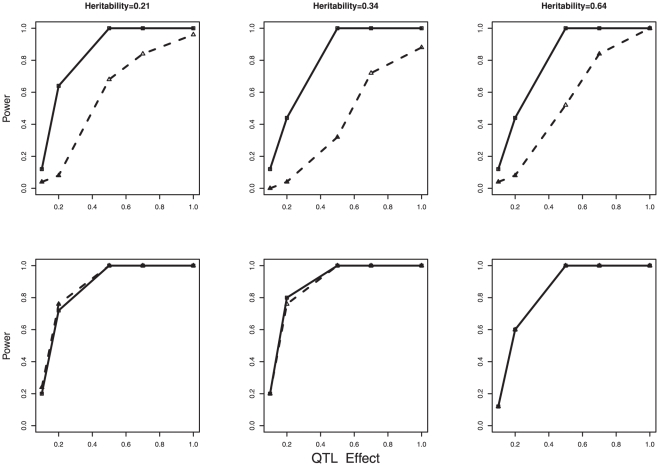
Figure 3. The power to detect QTL with different effect size for three different levels of heritability using GENMIX (□) and MMA (△).
The QTL effects in phenotypic standard deviation unit are in the X-axis and the power to detect QTL is in the Y-axis. The first row is for MAF of 0.10 and the second row is for MAF of 0.45.

