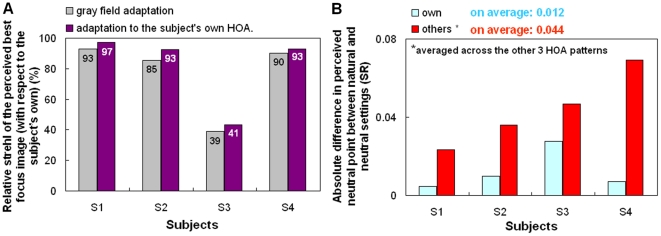
Figure 2. Testing scaled high order aberrations patterns.
a) Relative Strehl Ratio of the perceived best focus image (with respect to the subject's native level) for gray field adaptation or adaptation to each subject's own HOAs. b) Difference in Strehl Ratio between gray and natural adaptation when subjects were adapted to their own HOAs (blue) and other subjects' HOAs (red), averaged across the other 3 HOA patterns.

