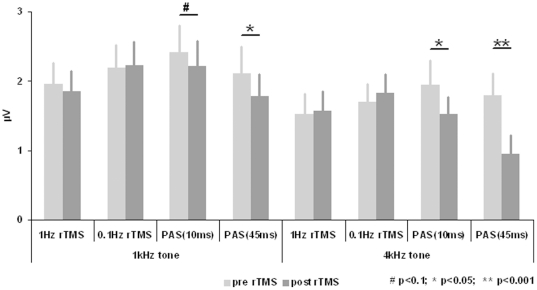
Figure 4. Amplitudes of the N1-P2 complex (difference of the amplitudes of both components) (mean±se).
N1 amplitudes were averaged for the time interval from 75 to 125 ms and P2 amplitudes from 150 to 250 ms at fronto-central electrodes (F3, F1, Fz, F2, F4, FC3, FC1, FCz, FC2, FC4, C3, C1, Cz, C2, C4, CP1, CPz, CP2).

