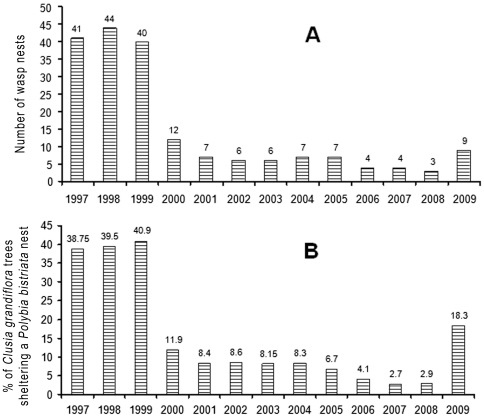
Figure 2. Variation in the number of wasp nests during a 13-year-long survey (1997–2009; wasp nests monitored each July).
A. Along 200 m of the stream situated at kilometre 23 on the road leading to the Petit Saut dam, all species pooled. The number of wasp nests was significantly higher between 1997 and 1999 than between 2000 and 2008 (Mann-Whitney test: U = 0.000: P<0.01). B. Variation in the percentages of Clusia grandiflora trees sheltering a Polybia bistriata nest between 1997 and 2009 (120 to 149 trees monitored each year in July). GLIM statistic; the complete model calculated from the core data resulted in a significant difference (GLIM; 13-year study; χ2 12 = 203; P<10−5), while the simplified model (four groups of years: 1997-1999; 2000-2005; 2006-2008; 2009) was not statistically different from the complete model (χ2 3 = 195.8, P<10−5; Δχ2 9 = 7.19, P = 0.104). This permitted us to conduct pairwise comparisons showing that these four groups of years were significantly different from each other (P = 0.034).

