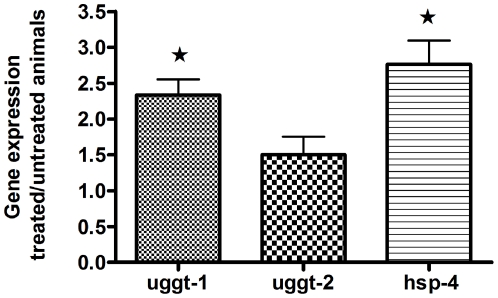
Figure 6. uggt-1 but not uggt-2 is upregulated under stress conditions.
Total RNAs from untreated and 5 µg/ml TN-treated animals were isolated and the levels of uggt-1, uggt-2 and hsp4 expression were quantified by real-time PCR using ama-1 as reference gene. Relative expression levels represents RNA expression in TN treated worms/RNA expression in untreated worms. The value obtained for untreated samples was considered as one. The values shown are the mean of three independent experiments. Error bars represent standard deviations * indicates significant differences.

