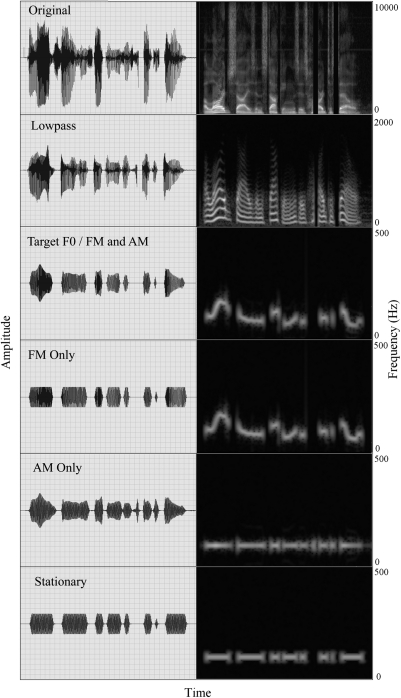
Figure 1.
Waveforms (left panels) and spectrograms (right panels) of a sample sentence. The rows from top to bottom show the original speech, a low-passed version at 500 Hz (lowpass), the F0 contour (named target F0 in exp. 1 or FM and AM in exp. 2), the frequency modulation of the F0 contour (FM only), the amplitude modulation of the F0 contour (AM only), or a sine wave cueing the presence of voicing (stationary).

