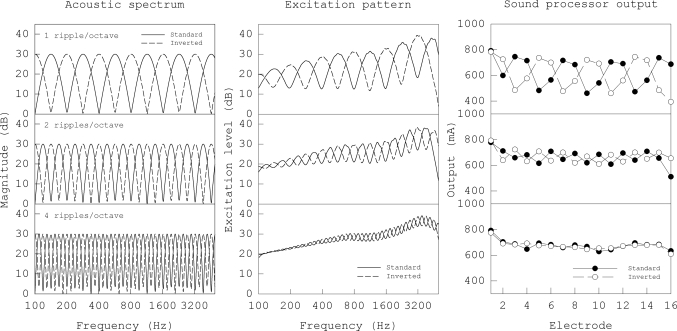
Figure 1.
Acoustic spectrum (left column), cochlear filter excitation pattern (middle column), and sound processor output (right column) for standard (solid lines) and inverted (dotted lines) spectral-ripple stimuli. Stimuli with ripple densities of 1, 2, and 4 ripples∕octave are shown in the upper, middle, and lower plot in each panel.

