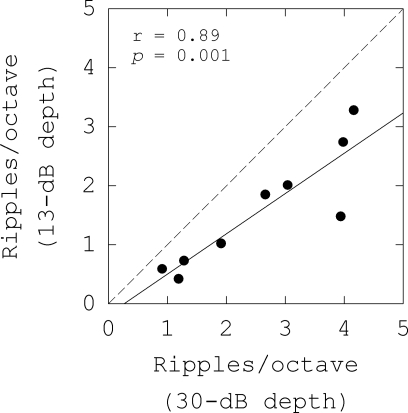
Figure 7.
Comparison between spectral-ripple thresholds obtained with 13- and 30-dB ripple depth in 9 CI users. Thresholds determined with 30-dB depth are plotted (on x axis) against thresholds determined with 13-dB depth (on y axis) for each subject. Linear regression is represented as a solid line. The dotted diagonal line represents y = x.

