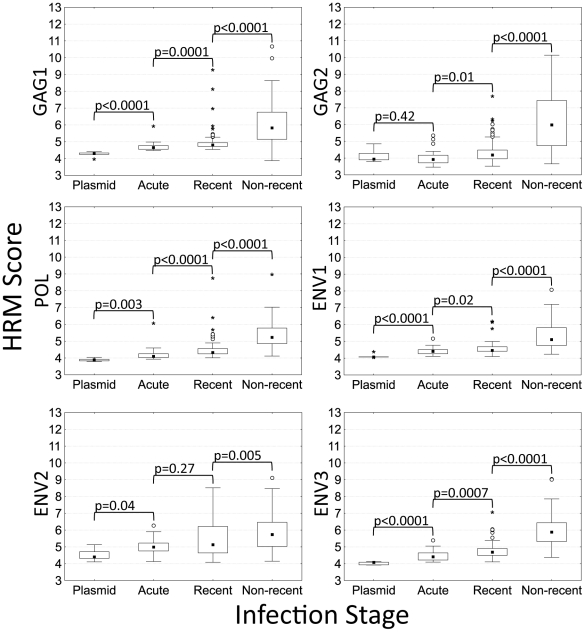
Figure 2. HRM scores for plasmid controls and samples from adults with different stages of HIV disease.
The box and whisker plots show the distribution of HRM scores for six regions in the HIV genome in control plasmids (n = 5; Subtype B) and in adults with acute (n = 20), recent (n = 102), and non-recent (n = 67) HIV infection (see text). For each column, the median (closed square), interquartile range (IQR, box), lower inner fence (first quartile [Q1] – [1.5 X IQR]) and upper inner fence (third quartile [Q3] + [1.5 X IQR], whiskers), outliers (greater than [Q3] + [1.5 x IQR], open circle) and extremes (greater than [Q3] + [3 x IQR], asterisk) are shown.

