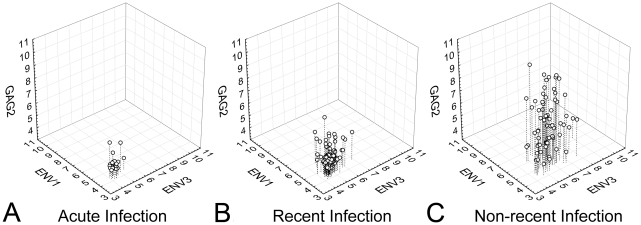
Figure 4. HRM diversity scores for GAG2, ENV1 and ENV3 plotted in 3 dimensions.
High HRM scores for these regions were determined to be independently associated with non-recent infection. The use of data from multiple regions in tandem demonstrates that HRM scores are generally compact in acute infection (A) with a slight increase in the distribution of data in recent infection (B), and wide dispersion of the data in non-recent infection (C).

