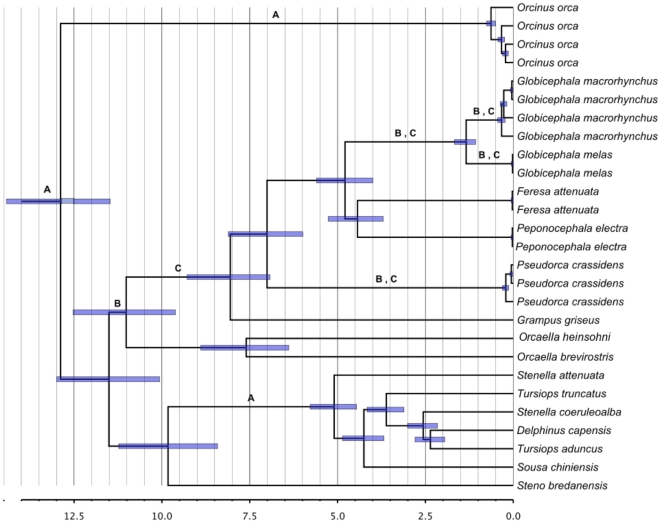
Figure 2. Chronogram for Delphinidae sequences reconstructed using the complete mitogenome.
Node labels correspond to: (A) Calibrated nodes, (B) Nodes tested for TMRCA deviation, (C) Nodes tested for PP support. Branch labels correspond to taxonomic groups within Delphinidae. Bars correspond to the 95% HPD for TMRCA of nodes and scale bar represents MYBP.

