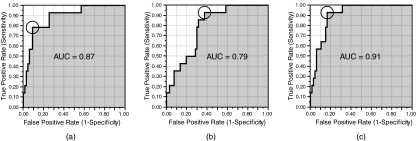
Figure 3.
ROC curves corresponding to various discriminators for the third 100-μm segment of the epithelium. AUC (gray area) ratios are indicated. Circles indicate optimal value for each discriminant. (a) Nuclear diameter, AUC = 0.87; (b) nuclear density, AUC = 0.79; (c) nuclear diameter and nuclear density, AUC = 0.91.

