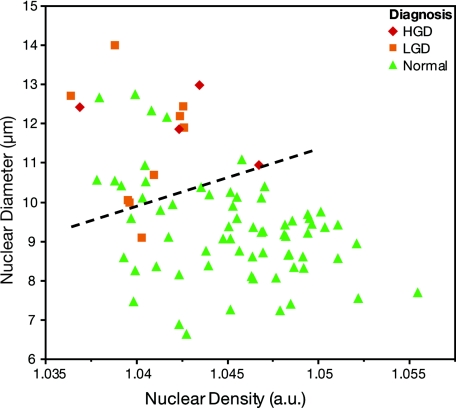
Figure 4.
Scatter plot showing nuclear size (micrometer) versus nuclear density for the epithelial depth segment 200 to 300 μm beneath the mucosal surface. Each point represents a single optical biopsy, and points are color-coded with respect to their pathological assessment. The dashed black line indicates the ideal decision line for these data for the prediction of dysplasia.

