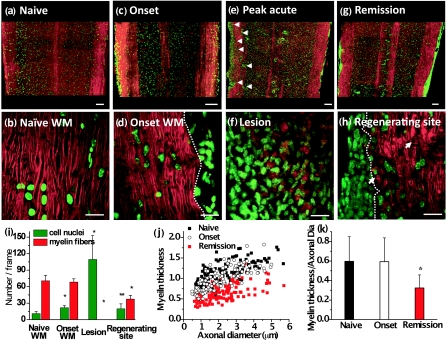
Figure 2.
Multimodal imaging of de- and remyelination in R-EAE. Red: myelin imaged by CARS microscopy; Green: Hoechst-labeled cell nuclei imaged by TPEF. (a) A mosaic image shows a large view of a lumbar spinal cord slice from a naïve mouse. (b) A magnified image displays parallel myelinated fibers and regularly organized cellular nuclei in the naive white matter. (c) A mosaic image shows a large view of a lumbar spinal cord slice from a R-EAE mouse at disease onset. (d) Parallel myelin fibers adjacent to the infiltrated cells at R-EAE onset. (e) A mosaic image shows a large view of a lumbar spinal cord slice at the peak acute stage of R-EAE. Demyelinating lesions are indicated by arrow heads. (f) Clusters of cells and myelin debris in a demyelinating lesion. (g) A mosaic image shows a large view of a lumbar spinal cord slice at the remission stage of R-EAE. Numerous cells are restricted in the meninges of the spinal cord and around blood vessels. (h) Remyelinated fibers in a regenerating site (on the right of the dotted line). The arrows indicate the presence of myelin vesicles. (i) Comparison of myelinated fiber number and cell number per frame of image in the naïve white matter, EAE onset white matter, acute demyelinating lesions, and regenerating sites. The frame size is 0.014 mm2. *p < 0.001, **p < 0.05 in comparison to cell nuclei and myelin fibers in the naïve white matter, respectively. (j,k) Comparison of myelin thickness versus axonal diameter at the naïve white matter, white matter at disease onset, and remyelinated fibers at the remission stage. *p < 0.001 in comparison to the naïve white matter. In (a), (c), (e), and (g), bar = 100 μm; in (b), (d), (f), and (h), bar = 20 μm.

