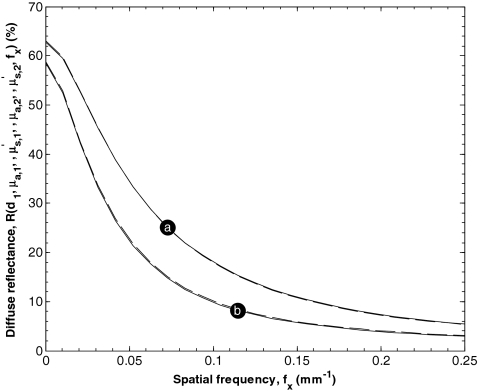
Figure 3.
Estimates of the diffuse reflectance as a function of spatial frequency fx between 0 and 0.25 mm−1 predicted by Monte Carlo simulations. The solid curve indicated by (a) was generated with μa, 1 equaling 0.1 mm−1, equaling 1 mm−1, d1 equaling 100 μm, μa, 2 equaling 0.01 mm−1, and equaling 1.7 mm−1, while the broken curve was generated with μa, 1 equaling 0.21 mm−1, equaling 0.5 mm−1, d1 equaling 50 μm and the same values of μa, 2 and . The solid curve indicated by (b) was generated with μa, 1 equaling 0.2 mm−1, equaling 2 mm−1, d1 equaling 20 μm, μa, 2 equaling 0.01 mm−1, and equaling 1.0 mm−1 while the broken curve was generated with μa, 1 equaling 0.1 mm−1, equaling 1 mm−1, d1 equaling 50 μm and the same values of μa, 2 and .

