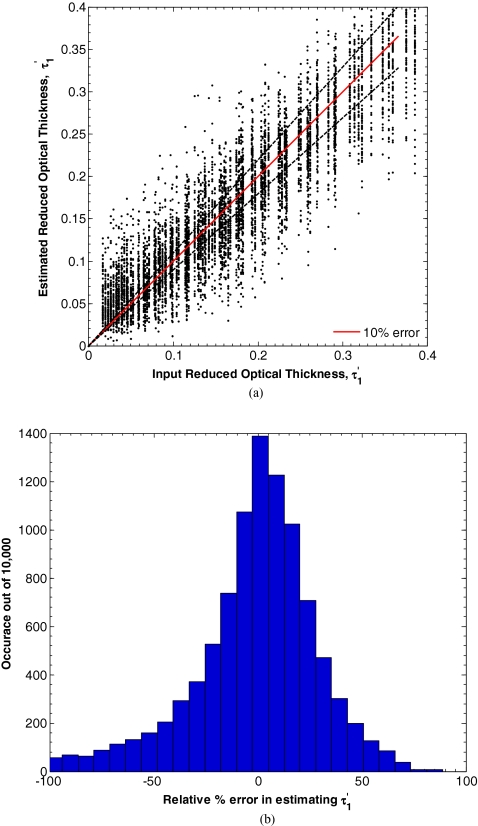
Figure 5.
(a) Estimates of for d1 between 15 and 150 μm, μa, 1 between 0.10 and 2.00 mm−1, equaling 1 mm−1, μa, 2 between 0.01 and 0.20 mm−1, and between 0.50 and 2.00 mm−1 determined by minimizing L in Eq. 7. (b) Histogram of the relative percent estimation error.

