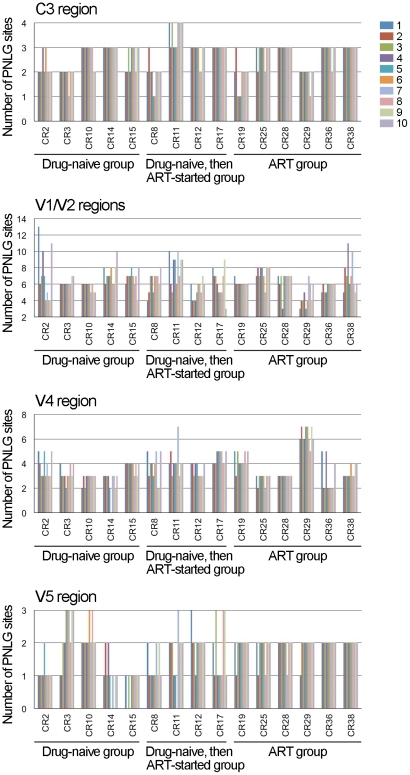
Figure 4. Changes in the number of PNLG sites in the gp120 regions.
PNLG sites in the gp120 regions were evaluated using N-Glycosite, and the number of the sites was then counted manually for 10 amino acid sequences derived from an individual. The data obtained from15 patient samples were then plotted together in chronological order of sampling, as indicated from 1 to 10. Env regions are denoted above the panels, whereas patient IDs and the status of treatment are denoted below the panels.

