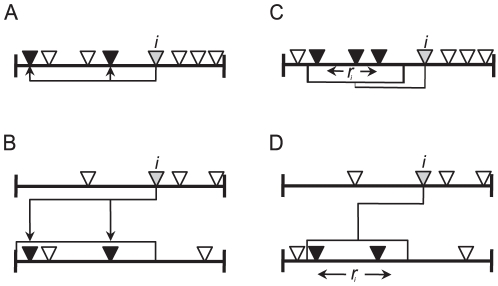
Figure 1. Diagrams comparing original food web models and their two-mode version.
(A) the cascade model: each species (represented as an inverted triangle) is assigned a random value being placed along an axis. A given species i (gray) potentially interacts with those species whose values are less than the value assigned to i (as indicated by arrows); (B) the cascade model for two-mode networks: species that pertain to different sets (e.g. plants and animals) are randomly placed along two separate axes. The upper axis represents the axis of consumers. Therefore a given species i in the upper axis potentially interacts with those species in the lower axis whose values are lower than the value assigned to i. (C) The niche model: Each species is assigned a random value ni and consume all species within a range of niche values ri. (D) The niche model for two-mode networks: species that pertain to different sets (e.g. plants and animals) are placed along two separate axes according to their ni. Each species in the upper axis consume all species in the lower axis that fall within a range of niche values ri.

