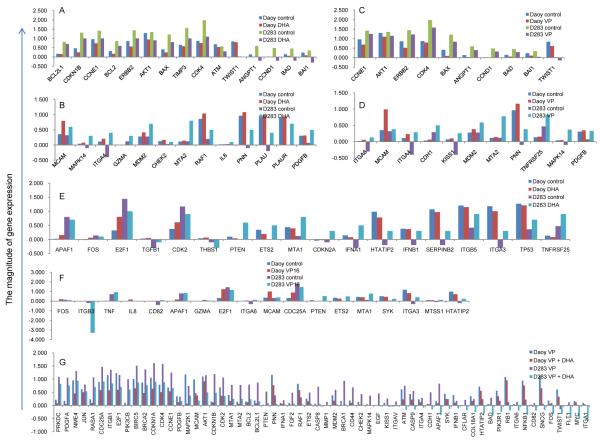
Fig. (3). Regulation of gene expressions in MB cells treated with DHA and VP16.
The Y axis represents the normalized intensity for the genes chosen for analysis using Human Cancer Pathway Finder Oligo GEArray. The ratio of the changes was calculated using the formula described in the material and methods section. A negative number indicates low to no expression for the gene in the cells. A) up regulated genes in response to DHA compared to control; B) down regulated genes in response to DHA compared to control; C) up regulated genes in response to VP16 compared to control; D) down regulated genes in response to VP16 compared to control; E) differentially regulated genes in response to DHA compared to the control; F) differentially regulated genes in response to VP16; G) down regulated genes in response to DHA + VP16 compared to VP16 alone.

