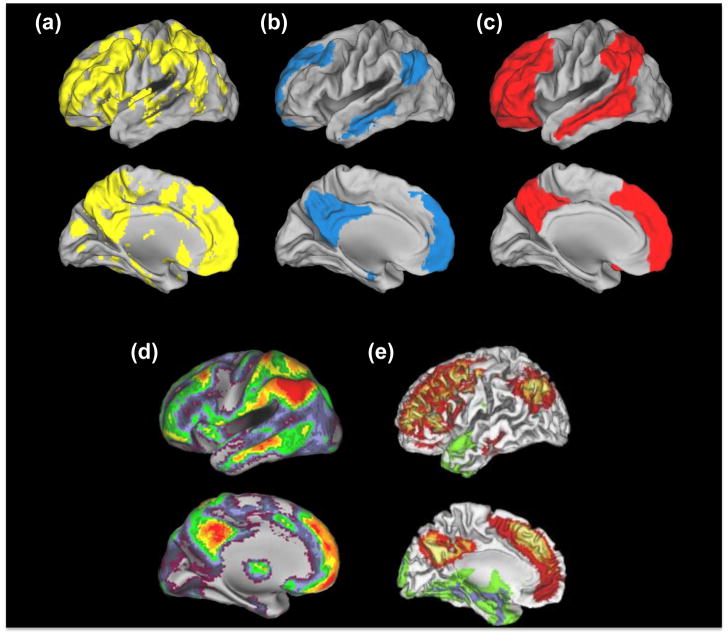
Figure 1. Spatial convergence between Aβ, DMN, heteromodal cortex and cortical hubs.
Examination across these panels reveals a high degree of convergence between amyloid distribution, multimodal cortex, cortical hubs and regions utilizing aerobic glycolysis, which is more consistent than the overlap between PIB uptake and the DMN. (a) PIB. Patterns of amyloid deposition in normal elderly controls with slightly elevated PIB values (N=15) are contrasted to low PIB elderly control subjects (N=49; thresholded using clusters at z>1.64 with a cluster significance threshold of p=0.05, corrected; statistical maps were binarized and displayed in Caret v5.6). These slightly elevated subjects have PIB levels below AD but higher than presumably Aβ-free young subjects (N=11; age 20–30), and likely represent the earliest signs of Aβ accumulation (see [44]). (b) DMN. 1 sample t-test of functional connectivity maps of the DMN (using a seed in the posterior cingulate at MNI coordinates 0, −54, 26; N=51; thresholded using clusters at z>3.09 with a cluster significance threshold of p=0.05, corrected; statistical maps were binarized and displayed in Caret v5.6). (c) Heteromodal Cortex. Cortical labeling of heteromodal cortex, adapted from [73]. (d) Hubs. Distribution of cortical hubs. Warmer colors reflect a greater degree of connectivity with other voxels (assessed by counting the number of voxels with a correlation coefficient greater than 0.25 with that specific voxel). Reproduced, with permission, from[16]. (e) Aerobic Glycolysis. Distribution of aerobic glycolysis. Red/yellow colors reflect greater aerobic glycolysis whereas green/blue colors reflect less aerobic glycolysis. Reproduced, with permission, from [18].

