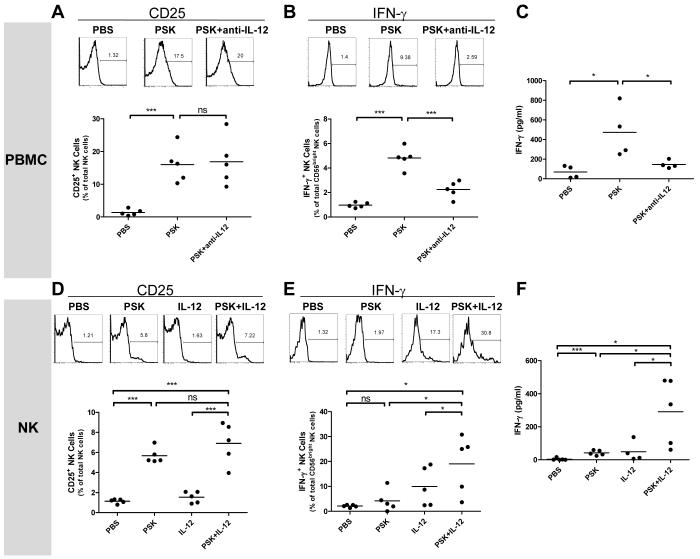
Figure 4.
PSK has both direct and IL-12-dependent effects on NK cells. Results shown in A-C were generated using PBMC, and results in D-F were generated using purified NK cells. (A) Expression of CD25 on NK cells in PBMC treated with PBS, PSK (100 μg/ml), or PSK plus anti-IL-12 Ab (10 μg/ml) for 24 hr. (B) Percentage of IFN-γ positive NK cells among total CD56bright NK cells in PBMC treated with PBS, PSK, or PSK plus anti-IL-12 Ab. (C) The level of IFN-γ in culture supernatant from PBMC treated with PBS, PSK, or PSK plus anti-IL-12 Ab. (D) CD25 expression in purified NK cells stimulated with PBS, PSK (100 μg/ml), IL-12 (1 ng/ml), or PSK+IL-12 for 24 hr. (E) Percentage of IFN-γ positive NK cells among total CD56bright NK cells in purified NK cells stimulated with PBS, PSK, IL-12, or PSK+IL-12. (F) The level of IFN-γ in culture supernatant of purified NK cells stimulated with PBS, PSK, IL-12, or PSK+IL-12. The FACS graphs show response from a representative donor. The summary graphs show data from 4-5 different donors analyzed in independent experiments. Each dot represents an individual donor. The horizontal line represents the group average. *, p<0.05; **, p<0.01; ***, p<0.001 between two treatment groups using Student t test.

