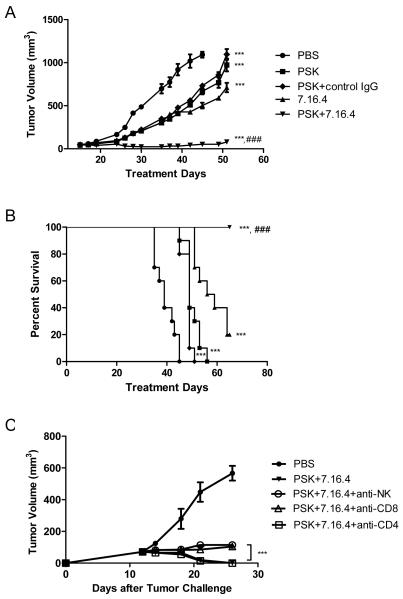
Figure 6.
PSK enhances the anti-tumor effect of 7.16.4 in neu transgenic mice, and the anti-tumor effect of combinatorial PSK and 7.16.4 is partially dependent on NK cells and CD8 T cells. In (A) and (B), shown are tumor growth curve (A) and overall survival (B) in mice receiving PBS (●), PSK (■), control IgG+PSK (◇;), 7.16.4 (▲), 7.16.4 plus PSK (▼). Each data point in (A) represents mean±SD in the treatment group, n=10 per group. Similar results were obtained from two independent experiments. ***, p<0.001 from control PBS group using ANOVA analysis. ###, p<0.001 between 7.16.4 and PSK+7.16.4 using ANOVA analysis. (C) shown are tumor growth curves in mice receiving PBS (●), PSK+7.16.4 (▼), PSK+7.16.4 with NK cell depletion (○), PSK+7.16.4 with CD8 T cell depletion (△), or PSK+7.16.4 with CD4 T cell depletion (□). The Treatment with PSK+7.16.4 mAb or control PBS was initiated on Day 12. The depletion antibodies were administered 3 times on the week before PSK treatment and then 2 times a week during PSK treatment. Each data point represents the average tumor volume in each group (mean±SD, n=5 per group). The difference between no depletion group (PSK+7.16.4) and depletion groups was calculated using two tailed Student t test. ***, p<0.001 between CD8 T cell or NK cell depletion group and no depletion group (PSK+7.16.4). There is no difference between CD4 T cell depletion group and no depletion group.

