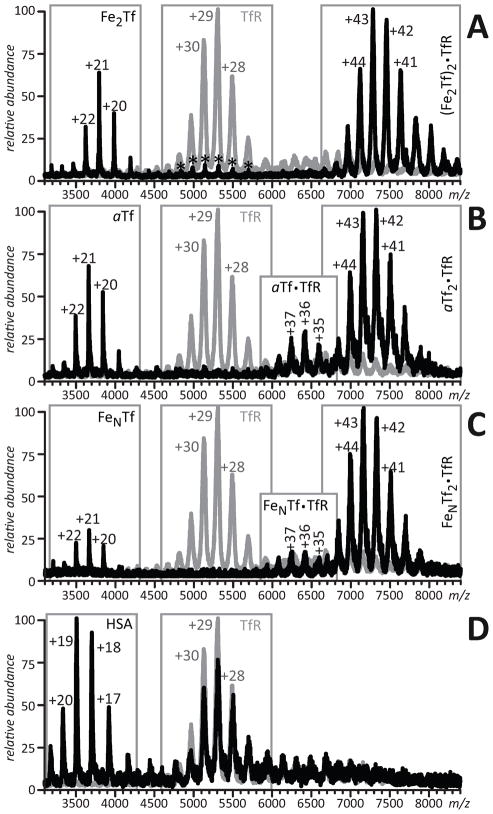
Figure 10.
ESI mass spectra of 6μM TfR solutions in 100 mM NH4HCO3 containing 10 μM Fe2Tf (A), αTf (B), FeNTf (C), and HSA (D). Gray traces represent mass spectra of TfR in the absence of binding partners. Asterisks represent hTf dimers. Reproduced with permission from [42].

