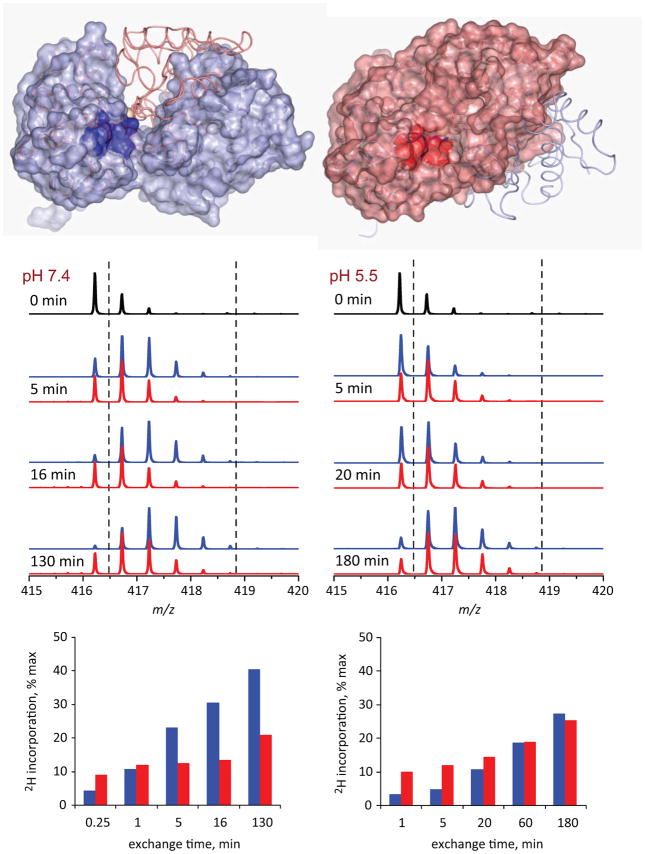
Figure 8.
Local HDX data for hTf/2N segment represented by peptic fragment (205–211). The top diagrams show localization of this segment within open (left) and closed (right) conformation of the protein. The mass spectra in the middle panel show evolution of the isotopic distribution of this peptide throughout the course of exchange reactions at neutral (left) and endosomal (right) pH. The red and blue traces correspond to peptides derived from holo- and apo-forms of hTf/2N, respectively. The two diagrams at the bottom show kinetics of deuterium incorporation within this peptide at neutral and endosomal pH.

