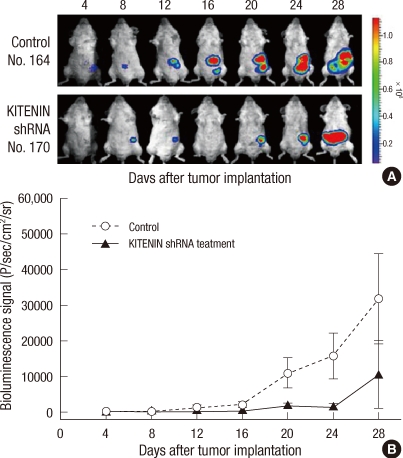
Fig. 1.
Quantitative photon counting analysis of the progression of orthotopically implanted tumors. (A) Detection of the progression process in control and KITENIN shRNA treatment groups. (B) Quantitative analysis of the progression process in control (○) and KITENIN shRNA treatment groups (▲) (n = 6). Points, mean of six mice per group; bars, SE.

