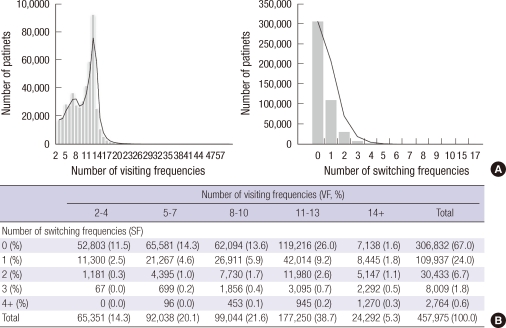
Fig. 1.
The distribution of individuals by the number of visiting frequency (VF), and switching frequency (SF) per year (A) The number of patients in 2005 was plotted as a function of the number of VF and SF. (B) Distribution crosstable. Data are the VF and SF in 2005. (1A): Visiting frequency (VF) among Korean elderly diabetic patients. Total N=457,975, median=10; mean = 9.0; starndard deviation = 3.6; range: 2-62. (2A): The switching frequency (SF) among Korean elderly diabetic patients. Total N = 457,975, median = 1; mean = 1.5; starndard deviation = 0.8; range: 0-17.

