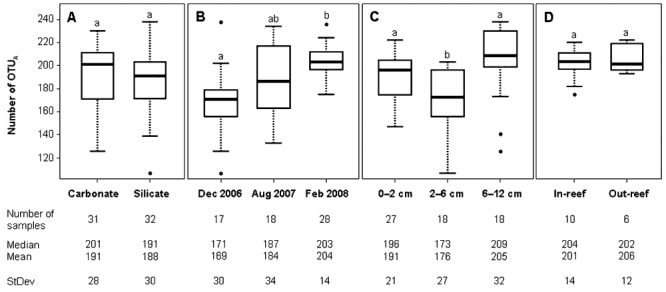
Fig. 1.

Number of ARISA-derived OTUA per (A) sand type, (B) season, (C) sediment depth and (D) in/out-reef location. Top, middle and bottom lines of boxes represent the 25th (lower hinge), 50th (median) and 75th (upper hinge) percentiles; whiskers represent the non-extreme sample minimum and maximum (i.e. less than 1.5 × the inter-quartile range of the box); outliers above and below whiskers denote extreme values. Different letters above each box denote a significant mean difference in OTUA number based on pairwise Wilcoxon–Mann–Whitney tests. The additional information specifies the total number of samples accounted for (including replicates), as well as the corresponding median, mean and standard deviation.
