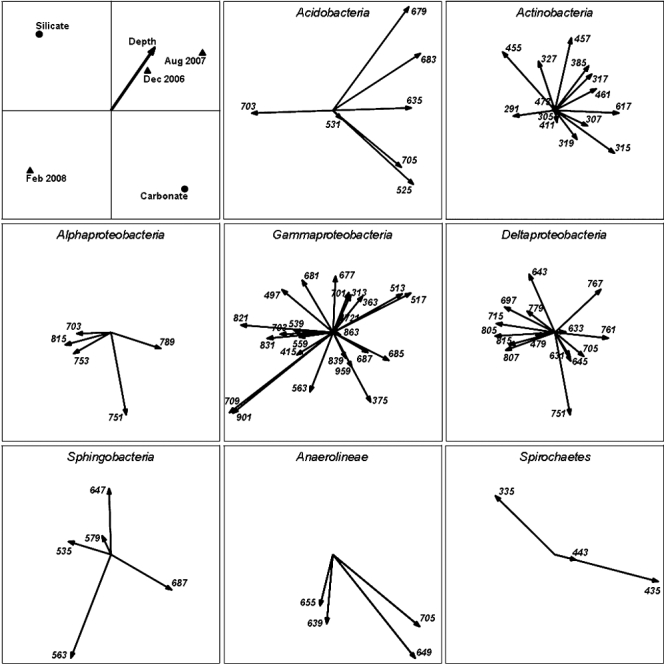
Fig. 4.

Relationships between sand type, season, sediment depth and changes in bacterial community structure, with focus on specific OTUA* shifts at the bacterial class level (≥ 80% identity). All biplots represent the same RDA ordination of linked ARISA data under direct constraint of explanatory factors, whereby the factor levels of sand type (circles) and season (triangles) were set as nominal variables, and those of sediment depth (vector) as continuous variables. Species vectors represent variation patterns of OTUA* that were linked to a 16S rRNA sequence of a given bacterial class, with numbers denoting the respective OTUA* (i.e. ARISA fragment) length in base pairs (for respective taxonomic assignments, see Table S2). Angles between vectors indicate the correlation between individual OTUA* distribution patterns, with collinear, opposite and orthogonal vectors, suggesting positive, negative and independent OTUA* covariation patterns respectively.
