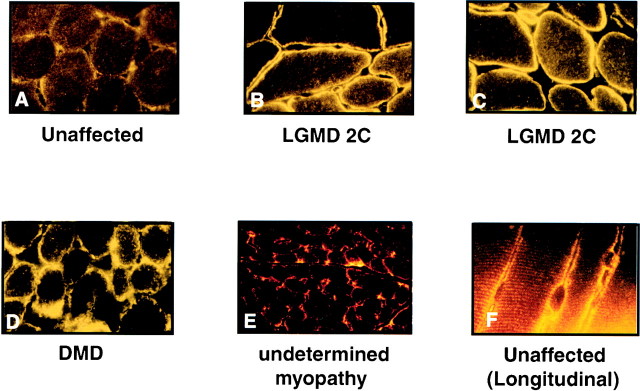
Figure 9.
FLN2 analysis of patients and null mice. (A) A–E are cross-sections of skeletal muscle biopsies. B–D are short exposure times because of the intense staining at the membrane. F is a longitudinal section of normal skeletal muscle exposed for a longer period to bring out Z-line pattern. All panels are at a magnification of 40 except panel E, which is at 25. B and C represent two different LGMD 2C patients. (G) Approximately 40 μg of protein from null mouse microsome preparations was loaded in each lane for Western analysis. The designation gsg−/− and dsg−/− refers to the γ-sarcoglycan and δ-sarcoglycan knockout mice, respectively. Membranes were probed with FLN2 antibodies (1:2,500). Coomassie brilliant blue staining was used to normalize protein loading (data not shown). FLN2 protein amounts relative to the control animal were analyzed using UN-SCAN-IT™ software (Silk Scientific Corporation).


